COMMANDE
CHASSEURS
2022
CHASSEURS
2022
fr. Il s’agit d’une infographie présentant, en 2022, l’état des commandes d’avions de combat dans le monde pour trois chasseurs occidentaux:
Le Rafale de Dassault, l’Eurofighter Typhoon et le Lockheed-Martin F-35 Lightning II.
Le nombre d’appareils commandés est détaillé par pays, chacun étant accompagné d’une carte non proportionnelle. L’ensemble est ensuite représenté dans un diagramme radial mettant en évidence l’écart entre la taille de la flotte des États-Unis et celle des autres pays.
en. This is an infographic showing, as of 2022, the different state of aircraft orders from around the world for three Western fighter jets:
The Dassault Rafale, the Eurofighter Typhoon and the Lockheed-Martin F-35 Lightning II.
The amount ordered is broken down per country, with a not-to-scale map of each one of them. This is all then shown on a radial chart showing the discrepancy between the size of the United-States fleet and the rest.

RAFALE
fr. En 2022, un total de 465 Rafales ont été vendus à 8 pays différents, dont 192 pour la France, le constructeur du Rafale.
en. As of 2022, a total of 465 Rafales were sold to 8 different countries. This includes 192 for France, who produces it.


EUROFIGHTER
fr. En 2022, 681 Eurofighters ont été vendus à 9 pays différents, dont 530 pour l’Allemagne, l’Espagne, le Royaume-Uni et l’Italie, les constructeurs de l’Eurofighter.
fr. En 2022, 681 Eurofighters ont été vendus à 9 pays différents, dont 530 pour l’Allemagne, l’Espagne, le Royaume-Uni et l’Italie, les constructeurs de l’Eurofighter.
en. As of 2022, a total of 681 Eurofighters were sold to 9 different countries. This includes 530 for Germany, Spain, the UK and Italy, who co-produce the Eurofighter.
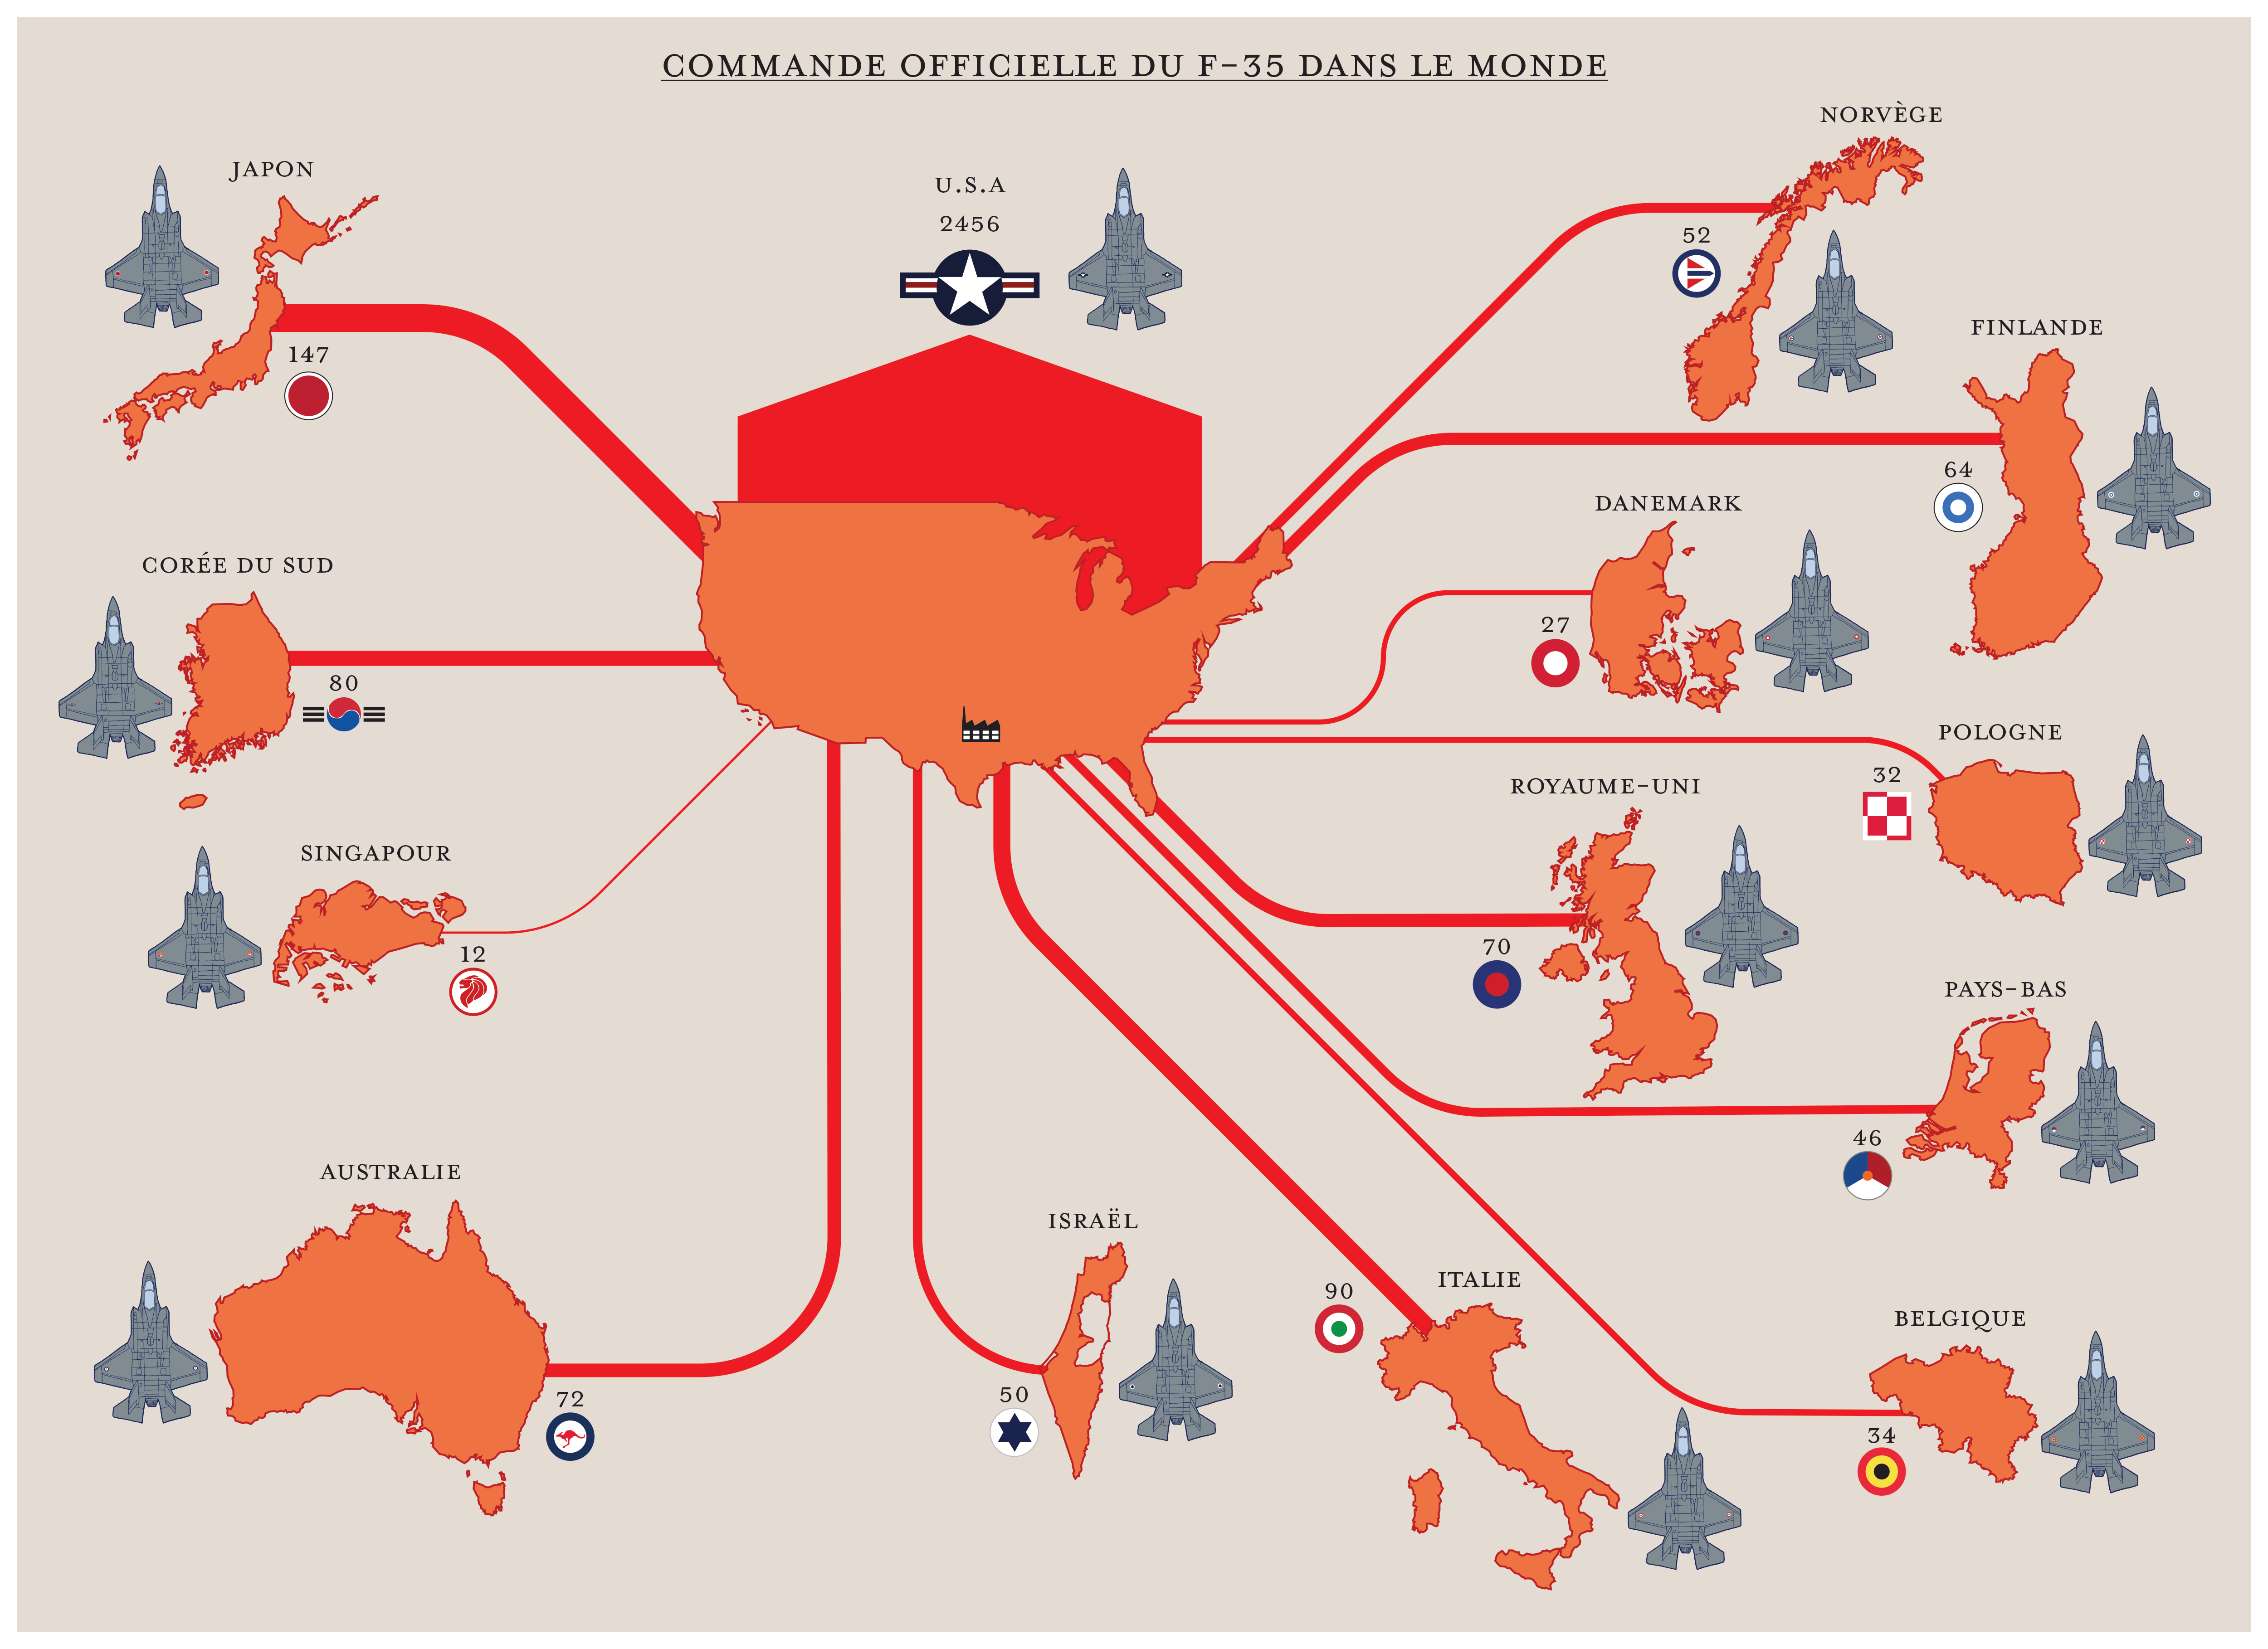
F-35
fr. En 2022, 3232 F-35 ont été vendus à 14 pays différents, dont 2456 pour les États-Unis, le constructeur du F-35.
fr. En 2022, 3232 F-35 ont été vendus à 14 pays différents, dont 2456 pour les États-Unis, le constructeur du F-35.
en. As of 2022, a total of 3232 F-35 were sold to 14 different countries. This includes 2456 for the United States, who produces it.

DIAGRAME
fr. Diagramme illustrant la disparité entre la commande américaine et celles du reste du monde.